

Hello!
In this post I will walk you through my attempt at fingerprinting GreyNoise sensors.
Before diving in, I want to give a huge shout out to GreyNoise, they greatly support the community by providing free API access to anyone! <3
If you don’t know what GreyNoise is, it’s a large collection of distributed servers in various Data Centers and cloud providers that passively listen to incoming, opportunistic traffic, in order to tell a story (contextualize) about incoming packets.
Opportunistic traffic is the random internet probes you see in your traffic logs as soon as you expose something to the wide internet. Security researchers as well as malicious bots are continuously poking publicly facing servers to determine if they are exploitable for malicious purposes, analytics, research/study, etc.
I was always curious how bad actors might evade GreyNoise sensors to not get caught when they mass scan the internet for vulnerabilities, and how one might go about identifying them among 4 billion addresses when they (likely) have no consistent pattern. This is how the fingerprinting journey begins.
Full disclosure: some parts of this post are educated guesses. I don’t really know how GreyNoise works in the backend.
Starting with Assumptions
Here are some assumptions I had:
- GreyNoise is deployed in most big cloud providers (Digital Ocean, AWS, Azure, etc.)
- GreyNoise is deployed in multiple other data centers.
- GreyNoise sensors are configured in a way that would not reveal their true identify/intent – for obvious Opsec reasons.
- GreyNoise will not necessarily flag you until you hit enough of their endpoints.
- GreyNoise analysts are on the lookout for actors attempting to fingerprint their servers.
With this in mind, I started exploring the GreyNoise visualizer to see what data they collect once opportunistic traffic hits one or more of their sensors. Let’s take SSH probe as an example…
When an SSH client hits GreyNoise, this is some of the data that gets collected:
- Source IP: 212.199.1.1
- Protocols: SSH
- Ports: 22
- ASN: 10101
- OS: Linux 3.x
Typically, you would get this kind of data from iptables logging and tools such as p0f for passive fingerprinting (e.g. to determine the OS / Kernel version using TCP fingerprinting).
In addition, I also noticed they collect HASSH hashes for incoming SSH traffic. If you don’t know what HASSH is, it’s an SSH fingerprinting method developed by Salesforce.
Before we jump into the fingerprinting methodology, we have to talk a bit about how HASSH works.
How HASSH works
HASSH allows SSH servers to fingerprint clients (and vice-versa) attempting to connect by examining the client’s handshake data, such as the ciphers and compression algorithm the client is offering, etc.
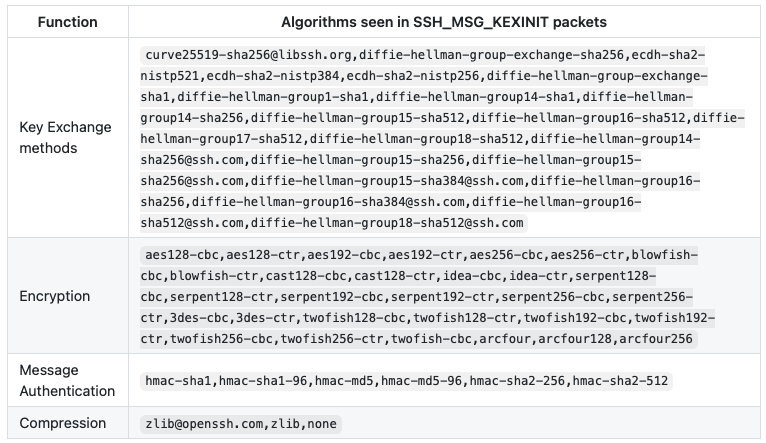
When an SSH client connects to a server, it will provide a few functions as part of the client handshake (SSH_MSG_KEXINIT packets):
- Key Exchange Methods
- Encryption
- Message Auth
- Compression
HASSH concatenates them together and hashes them using MD5, this hash could then be used to uniquely identify the SSH client (e.g. whether it’s OpenSSH, Dropbear SSH, etc.)
The following table are optional algorithms a client can offer for each function during the handshake:
And this is where my fingerprinting method begins…
The Fingerprinting Method
To start, I did not know in great detail how SSH handshakes work at the low levels, but my exploration started with an assumption:
Do SSH servers even care what algorithms the client provides once there’s a mutual agreement on the first match?
Apparently, they don’t and that somewhat makes sense, otherwise they would have to keep a list of all the possible algorithms and check what the client provides against it every time.
What this means is, SSH clients could offer custom strings in the encryption payload of the handshake:
aes128-cbc, aes128-ctr, aes192-cbc, RANDOM_STRING
If the SSH server accepts aes128-cbc, then it will simply ignore the rest of the remaining algorithms in the list.
The HASSH MD5 would still be constructed by all the algorithms the client provided, including the random string. It will then get captured by GreyNoise’s sensors, and eventually appear on their Visualizer interface:
From a networking standpoint, here is how a client handshake with a modified encryption algorithm list looks like in Wireshark:
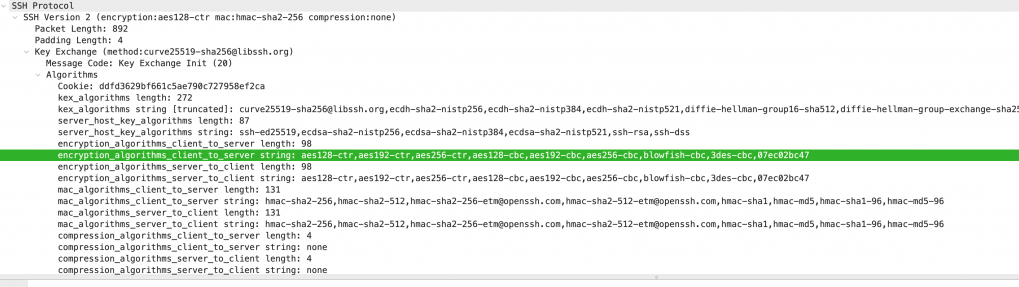
You can observe the random string I appended to encryption_algorithms_client_to_server, which is set to 07ec02bc47.
To recreate the SSH handshake, I used the Python Paramiko SSH client. Here is how you can use it to randomize your ciphers using Transport._preferred_ciphers.
import paramiko

unique_algo = 'RANDOM_STRING'

paramiko.Transport._preferred_ciphers = ('aes128-ctr','aes192-ctr','aes256-ctr',unique_algo, )

client = paramiko.Transport(('remote_addr', 22))
client.connect(username='test', password='test')

session = client.open_channel(kind='session')
Time to Execute
There are multiple ways in which you could try to fingerprint GreyNoise, few examples are custom User-Agents, custom HTTP paths etc. However, I assumed the HASSH approach would be somewhat the stealthiest and hardest to detect by GreyNoise analysts.
With this in mind, the next step is to start negotiating remote SSH connections with a unique handshake for each IP, by appending our unique string, which in this case will be the remote server IP.
Here is a very, very simple architecture how everything will connect together
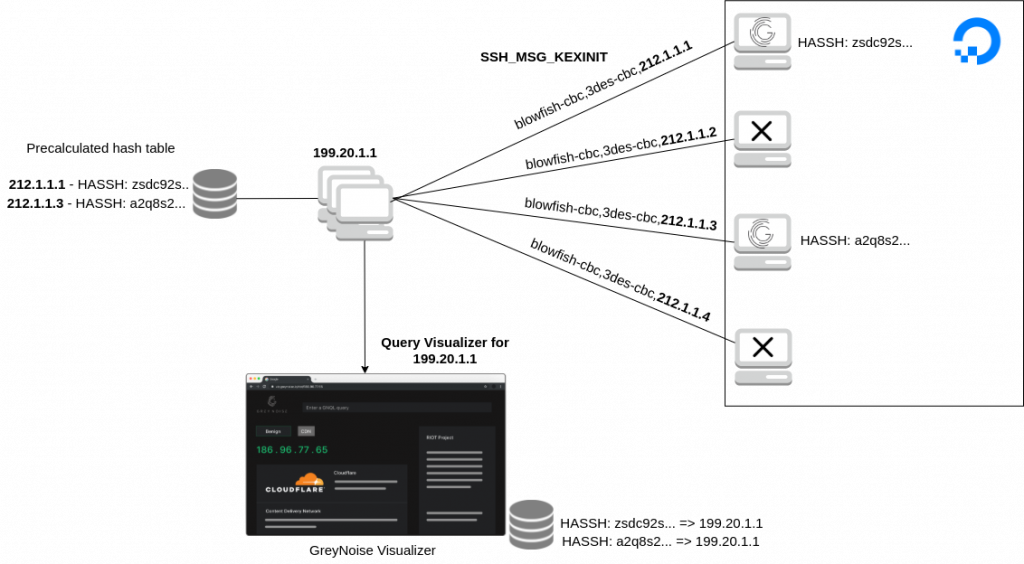
I used Digital Ocean instances for this research and cycled through a bunch of IP addresses until I found a few that GreyNoise did not know about:
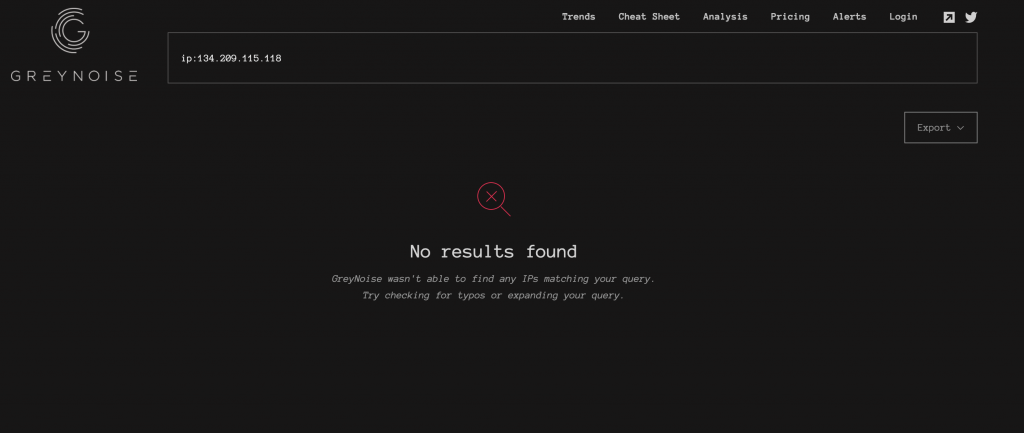
As for my potential targets, I decided to focus only on Digital Ocean IP space. It is smaller than other cloud providers and I also wanted this to be as quick as possible.
As for the fingerprinting mechanism, take a look at the following code, which was the heart of the fingerprinting approach:
import paramiko
from hashlib import md5


def calc_hash(text):
  return md5(text.encode()).hexdigest()

POSSIBLE_GREYNOISE_IPS = ['212.1.1.1', '212.1.1.2', '212.1.1.3', '212.1.1.4']

for target in POSSIBLE_GREYNOISE_IPS:

  paramiko.Transport._preferred_ciphers = ('aes128-ctr','aes192-ctr','aes256-ctr',target, )

  fingerprint = f'curve25519-sha256@libssh.org,ecdh-sha2-nistp256,ecdh-sha2-nistp384,ecdh-sha2-nistp521,diffie-hellman-group16-sha512,diffie-hellman-group-exchange-sha256,diffie-hellman-group14-sha256,diffie-hellman-group-exchange-sha1,diffie-hellman-group14-sha1,diffie-hellman-group1-sha1;aes128-ctr,aes192-ctr,aes256-ctr,aes128-cbc,aes192-cbc,aes256-cbc,blowfish-cbc,3des-cbc,{target};hmac-sha2-256,hmac-sha2-512,hmac-sha2-256-etm@openssh.com,hmac-sha2-512-etm@openssh.com,hmac-sha1,hmac-md5,hmac-sha1-96,hmac-md5-96;none'

  client = paramiko.Transport((target, 22))
  client.connect(username='test', password='test')

  session = client.open_channel(kind='session')
  redis.set(calc_hash(fingerprint), target)
To explain this simply, here is what’s happening:
- We hard code a set of key exchange methods, compression algorithms and other handshake properties and include our unique string, which is set to be the remote server IP.
- We connect to SSH servers in the Digital Ocean IP space (represented by the array of IPs)
- We pre-calculate the HASSH fingerprint that GreyNoise will eventually log and show in the dashboard.
- We store the hash fingerprint and the original remote IP in a local database.
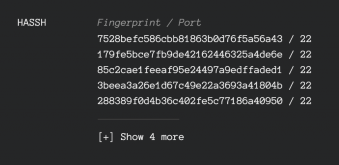
After a few hours of scanning, GreyNoise started flagging one of my servers with some initial data:
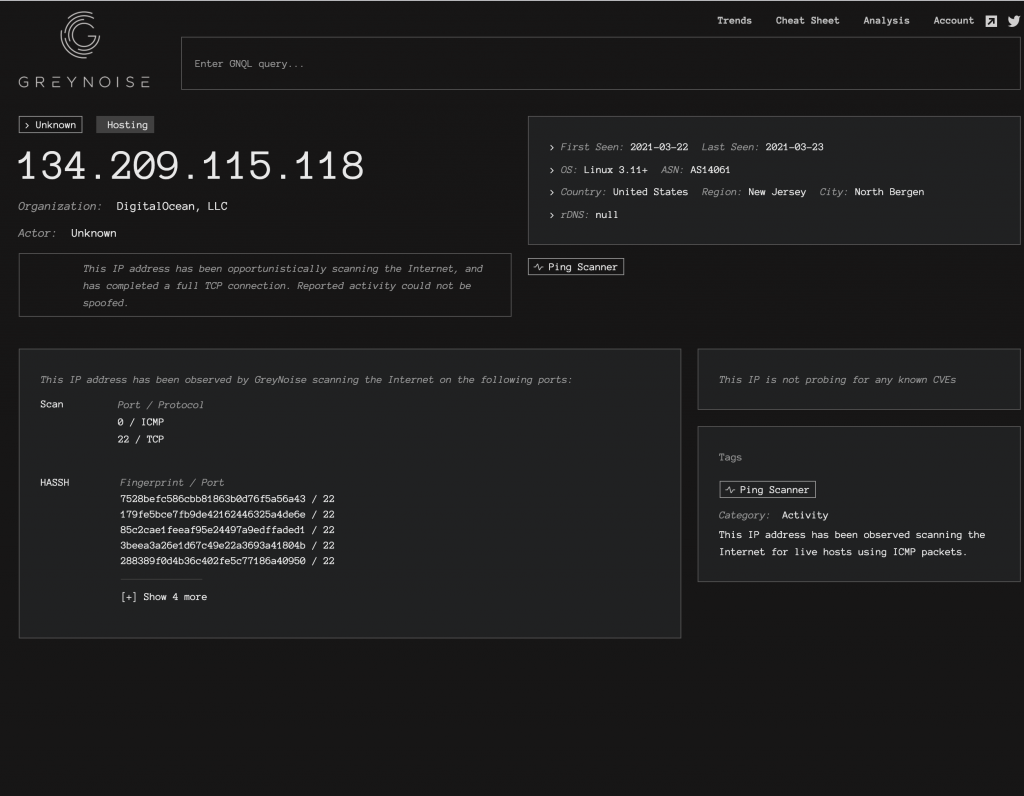
GreyNoise has tracked ICMP and SSH attempts from this VPS, which came from my initial ping sweep followed by the SSH connections. We can also already see a few HASSH MD5 hashes logged.
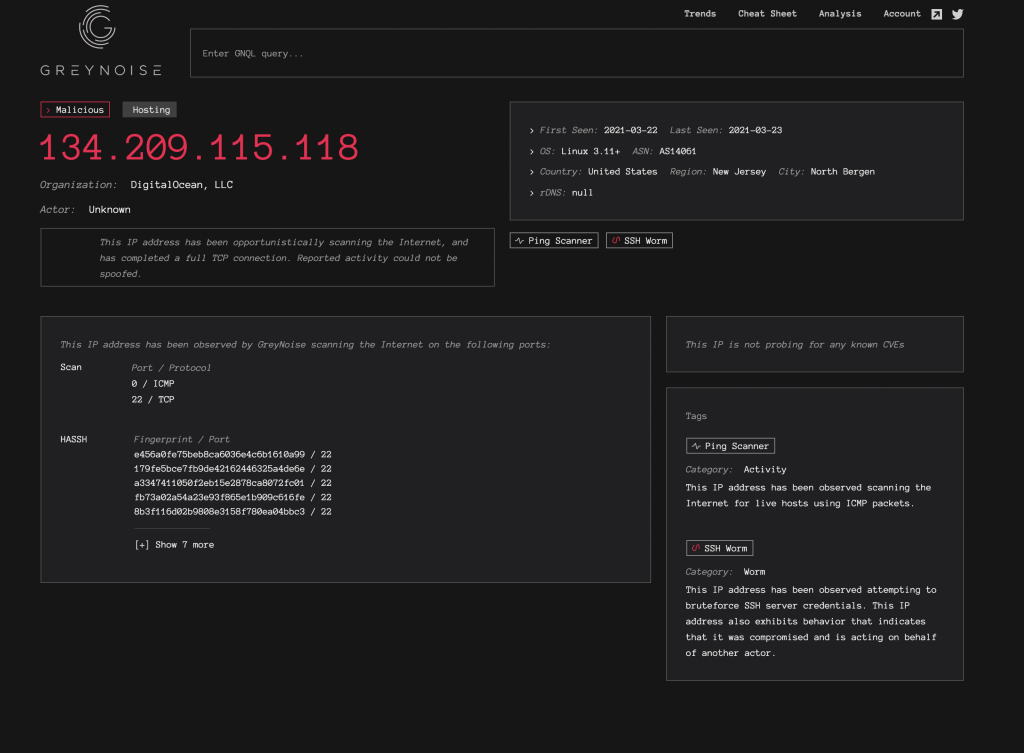
In practice, I attempted each SSH connection 3 times in order to trigger their ‘SSH Worm‘ heuristic and ensure my server ends up on their Visualizer.
A few hours later, the IP has been flagged as malicious:
At one point, my VPS had over 50 MD5 hashes listed. They did not all show up in the UI for some reason, but if you switched to the developer tools, all 50 were in the JSON response returned by the visualizer.
Here is a partial log of what went into Redis during the scan:
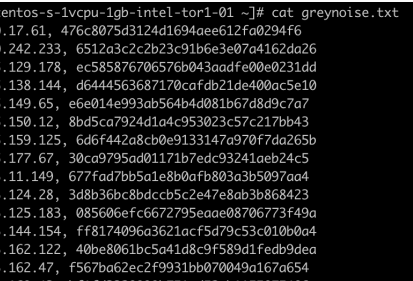
My immediate assumption was: if I was able to log 50 hashes, does it mean I was able to hit 50 sensors?
I went and did a reverse lookup of these hashes, to find the original IP addresses associated with them, easy right?
The tracked servers turned out to be false positives (booo) I am not exactly sure why though. Some IPs were apparently GreyNoise servers, and some weren’t. The exact count is not something I have visibility into though.
I can only speculate what the reasons behind this are, one is maybe due to how aggressive my threads were which may have caused race conditions and wrong pre-calculated hashes, who knows 🙁
GreyNoise did disclose that they fixed a bug as a result, but did not disclose the details, they shipped over some awesome swag though! 🙂

GreyNoise is one of my favourite (counter) threat intelligence tools and I was excited I could contribute just a little to improve their Opsec.